Another aspect of my work is the attempt to answer historical questions with computers, a concept known as digital history or digital humanities.[1] Before starting my doctorate program, I worked fulltime in Information Technology for twelve years. During that time, I worked in several sectors and verticals and across various subspecialties within the IT domain. So, using those experiences while venturing into a new career seemed beneficial. Drawing on the past experience is part of why I am in Budapest since my primary role on the “The Post-1956 Refugee Crisis and Hungarian Émigré Communities During the Cold War” Project draws on my digital humanities expertise.
Digital Humanities can be a lot of things, from as broadly defined as using the search function on your computer during research to complicated data processing and analysis scripts. It even includes building websites, like the one I linked to above. So, I will provide an example of what digital humanities looks like and how it can be useful in scholarship and for broader audiences.
Earlier this week, while writing for my dissertation, I realized I needed to know the change in the Hungarian-born population of Trenton, New Jersey. Fortunately, I already knew how to find this because of a graphic I designed earlier to answer a different but similar question.
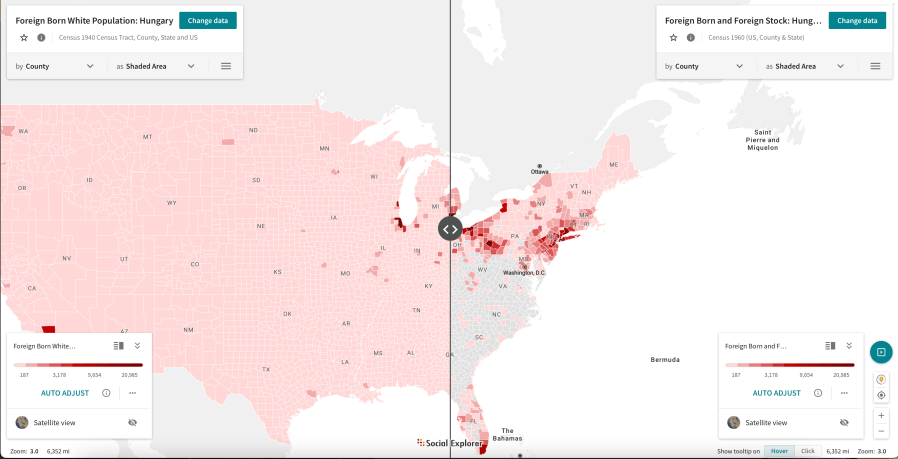
A couple of years ago, I wanted to know where the largest concentrations of Hungarian-born residents in the United States as answering this question would help me find source materials for my dissertation. Fortunately, the US Census is a great way to access this information, unfortunately, Census data can be a mess, particularly when wanting to map it. Since my project focuses on refugee resettlement in 1956-1957, I immediately started looking for the 1950 Census data and compare it with data from the 1960 Census and I would be able to see the change.
There are different ways to do this task. One would be to download the original census data and work to align it with a map using mapping software like ArcGIS. Alternatively, I could use a tool like SocialExplorer.[2]SocialExplorer is an online tool that brings together a variety of publicly available information, also known as open-source information, and prepares it for mapping. In this case, it transformed location information from Census data into a mappable form.[3] Because the US Commerce Department was in the process of releasing the detailed information from the 1950 Census, SocialExplorer did not have its 1950 Census data available. So, I used the 1940 Census instead, which was fortuitous since I later realized that comparing 1940 to 1960 was actually more useful.
The benefit of tools like SocialExplorer is that it also made visual comparison easy, by allowing me to place both sets of data in the same map and use a slider to move between them. The result is this:

It is a map of the United States showing every county and color-coded by the number of Hungarian-born residents.
I quickly realized that the Cleveland, Ohio and the New Brunswick, New Jersey held the largest number of Hungarian-born residents, and that extended to the areas immediately around them. Knowing this, I was able to look for Hungarian-language newspapers in those areas and found several collections.
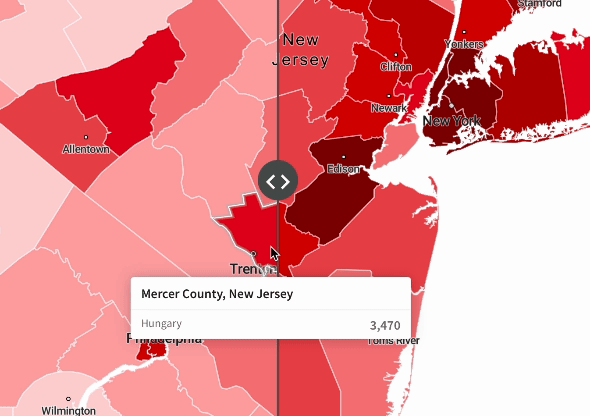
Which brings us back to this week when I needed to know the Hungarian-born population in Trenton, New Jersey. I knew I already had a map to answer that question. I zoomed in on Mercer County, New Jersey and found my numbers. The Hungarian-born population of that county doubled between 1940 and 1960.
But this is not the first time I revisited this map. It helped answer a myriad of small questions since I made it. That is part of what is fascinating to me about digital humanities, the process of answering one question can produce a tool useful for answering related questions. Plus, it does so in a way that can be shared with others. Take a look yourself:
[1] Digital History is a technically a subset of Digital Humanities since the tools and techniques can often be used in other disciplines outside of history. At the same time, Digital History is inherently multidisciplinary and often incorporates theories and practices from other fields via the shared digital toolset.
[2] I am very grateful to Josh Been, the Digital Humanities Librarian at Baylor University, for his courses on mapping data that included a tutorial of SocialExplorer.
[3] US Census data is an amazing source but also a bit restrictive. Since the data contains detailed information about individuals and households, the data is only available in aggregated form for the first 70 years. Thus, the information about individuals from the 1950 Census only became available about a year ago. Instead, the data is aggregated so that it provides information via larger geographic categories. In the case of birthplace, the smallest political unit available is the county.
